A practical guide for young finance professionals to learn market sizing with real calculations. Build credible market models that survive investor scrutiny and drive better business decisions.
Introduction
A couple of days back, Priya, a CA trainee, walked into my cabin looking utterly confused.
She had been going through some research and stumbled upon this DemandSage report that completely rattled her. “42% of startups die because they completely misread what customers want,” she said, waving her laptop around.
“Sir, is there any way these startups could have avoided this? Like, some method to actually understand if people want their product?“

I leaned back in my chair and smiled. “Absolutely,” I told her.
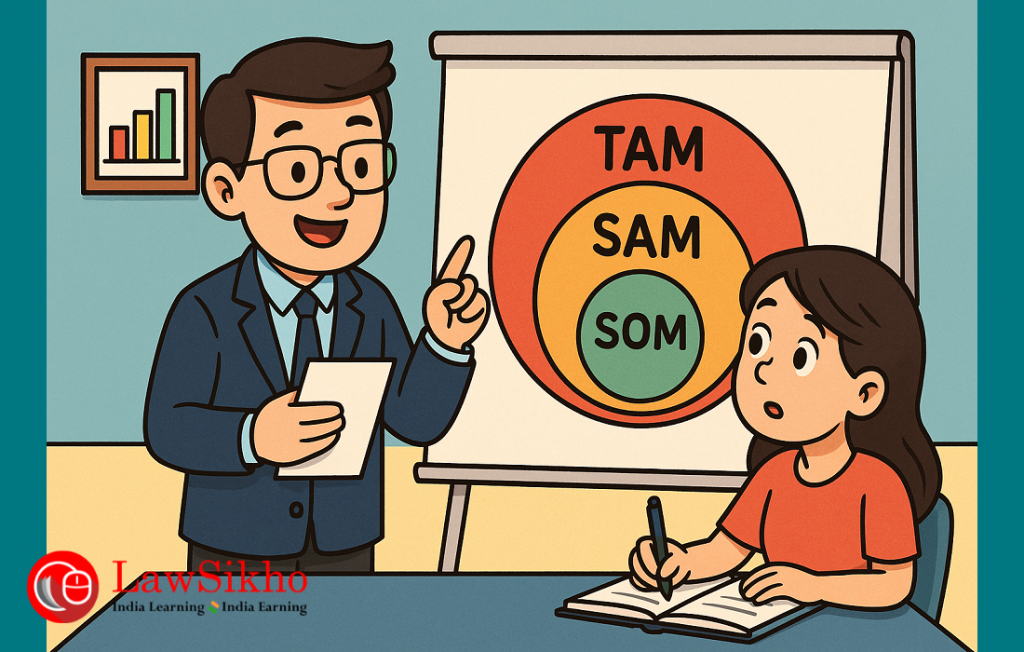
“Let me introduce you to three little acronyms that can make or break any business—
- Total Addressable Market (TAM),
- Serviceable Available Market (SAM), and
- Serviceable Obtainable Market (SOM).“
Her eyes lit up immediately. “What do they mean?“
I explained. “Think of them as your business compass. TAM tells you how big the entire market could be if you captured everyone. SAM shows you the slice you can realistically go after. And SOM? That is what you can actually grab with your current resources and strategy.“
She was scribbling notes furiously. “But, sir, how do we actually calculate these? Everyone talks about them, but nobody explains the math.“
That is when I realised something.
Here was a bright finance professional asking the exact question that most people in our industry struggle with.
We all know what TAM, SAM, and SOM stand for.
We throw these terms around in meetings like confetti. But when it comes to actually building these models from scratch? Most of us are stumbling in the dark.
So I pulled out a fresh sheet of paper and started walking her through a complete example. We used a hypothetical personal finance app called FinWell, targeting urban millennials in India.
Step by step, calculation by calculation, I showed her how to size markets like a seasoned investment analyst.
In this article, I am going to teach you exactly what I taught her that day.
No textbook theory.
No abstract concepts.
Just practical, hands-on calculations using real data that you can apply to any business tomorrow. Whether you are evaluating startups for investment, building business cases for new products, or trying to understand market opportunities, these frameworks will become your most reliable tools. If you are looking for opportunities (offline or remote) in investment banking, learning these calculations will set you apart in interviews and day-to-day analysis work.
By the end of this, you will never again have to fake your way through a market sizing discussion or rely on someone else’s questionable assumptions. You will know how to build these models yourself, validate every number, and present market analysis that actually holds water.
Understanding the basics: TAM, SAM & SOM
“Okay Priya,” I said, pulling up a fresh Excel sheet on my screen. “Before we dive into the calculations, let us make sure you understand what we are actually measuring here.“
She nodded eagerly, pen ready.
“Think of it like this,” I continued. “Imagine you are opening a restaurant in Bangalore. TAM would be every single person in India who eats food. That is your Total Addressable Market—the absolute maximum size of your opportunity if you somehow managed to feed every Indian.“
Priya laughed. “That sounds impossible.”
“Exactly! That is why we have SAM—Serviceable Available Market. This would be people in Bangalore who eat at restaurants, have disposable income, and match your target demographic. Much more realistic, right?“
She was already connecting the dots. “And SOM would be the customers you can actually get with your budget and resources?“
“Bingo! Serviceable Obtainable Market. That is the slice you can realistically capture in, say, the next three years, given your location, marketing budget, staff capacity, and competition.“
I drew three circles on my notepad—one massive, one medium, one small. “TAM gives investors the big vision. SAM shows your strategic focus. SOM proves you understand execution reality.“

Why each metric matters for decision-making
“But Sir,” Priya interrupted, “why do we need all three? Can we not just focus on the realistic number?“
I shook my head. “Each serves a different purpose. Let me give you a real example.“
I pulled up a recent pitch deck from my files. “Last month, a fintech startup came to us seeking Series A funding. Their TAM was ₹50,000 crores—the entire Indian digital payments market. Impressive, right?“
She nodded.
“But their SAM was only ₹5,000 crores because they were targeting tier-2 cities specifically. And their SOM? Just ₹500 crores over five years. Now, which number do you think mattered most to our investment decision?“
Priya thought for a moment. “The SOM? Because that is what they can actually achieve?“
“Smart girl. But here is the thing—we needed all three. The TAM showed us the market was not going to disappear tomorrow. The SAM proved they understood their niche. And the SOM demonstrated realistic growth expectations. Without any one of these, the investment case falls apart.”
Three approaches to market sizing
“Now, before we calculate anything,” I said, opening a new document, “you need to know there are three main ways to size markets. Each has its place.“
Top-Down Approach “This is what most people start with,” I explained. “You take industry reports, government data, or research studies and work your way down. Like saying ‘India has 1.4 billion people, X% use smartphones, Y% use financial apps, therefore our market is Z.‘”
Priya was taking notes. “That sounds straightforward.“
“It is, but it is also dangerous. You are making a lot of assumptions based on other people’s research. Great for initial estimates, terrible for detailed planning.“
Bottom-Up Approach “This is where the real work happens,” I continued. “You start with your actual customer segments, estimate how many exist, calculate their spending patterns, and build up from there. Much more accurate, but requires serious legwork.“
“Like actually surveying potential customers?“
“Exactly. Or analysing competitor data, studying user behavior, and understanding price sensitivity. It takes time, but the numbers are solid.“
Value Theory Approach “And finally,” I said, “there is value theory. This works best for completely new products where no market data exists yet.“
Priya looked confused.
“Think about it this way,” I explained. “When Uber launched in India, there was not really a ‘ride-hailing market’ to measure. So they had to estimate based on the value they were creating—time saved, convenience added, cost compared to alternatives. You are essentially calculating the economic value your product delivers to customers.“
Setting up Priya for success
“Here is what we are going to do next,” I said, turning to face her directly. “We will take our FinWell example and work through all three approaches. You will see exactly when to use each method, where the data comes from, and how to validate your assumptions.“
Her eyes lit up. “And we will use real numbers?“
“Absolutely real numbers. Government statistics, industry reports, competitor analysis—the works. By the time we are done, you will be able to size any market confidently.“
I could see the wheels turning in her head. “Sir, one more question. How do I know if my market sizing is any good?“
I smiled. That was exactly the right question to ask. “Priya, that is where most people mess up. They build these elaborate models but never sense-check them. We will cover validation techniques that will save you from embarrassing yourself in client meetings.“
She laughed nervously. “Has that happened to you?“
“More times than I care to admit. But that is how you learn. Ready to dive into the FinWell case study?“
She nodded enthusiastically, laptop open and ready.
Disclaimer: This article uses hypothetical examples and publicly available data for educational purposes. While we reference industry reports and government statistics, access to more comprehensive and current market data often requires paid subscriptions to research firms like McKinsey, BCG, Redseer, or FICCI. For actual investment or business decisions, we recommend accessing the latest reports from these sources.
The FinWell case study
“Alright Priya,” I said, clearing my desk and opening a fresh spreadsheet. “Time to get our hands dirty. Meet FinWell—our hypothetical personal finance app that’s about to teach you everything about market sizing.“
She leaned forward, clearly excited.
“Here is the setup,” I continued. “FinWell helps urban millennials manage their money better. Think budgeting, expense tracking, investment recommendations—all through a slick mobile app.
The target?
Salaried professionals aged 25-40 living in Indian metros and tier-1 cities.“
“What is the revenue model?” Priya asked.
“Smart question. ₹4,000 per year subscription. Premium features, personalized coaching, and exclusive investment options. We might add some commission income later, but let us keep it simple for now.“
I pulled up a blank Excel sheet. “Now watch closely. We are going to calculate TAM, SAM, and SOM step by step. And I want you to question every single assumption I make.“
Step 1: Calculating TAM (Total Addressable Market)
“Let us start with the big picture,” I said. “For TAM, we need to know: how many millennials are there in India, and what is our theoretical maximum revenue?”
I opened the Census of India website. “According to population projections based on the [Census of India 2011] and demographic trend analysis, India has approximately 440 million people aged 25-40 as of 2025. That is our starting point.“
Note: India’s decennial Census 2021 was postponed indefinitely due to COVID-19, making this the first time in 150 years that census operations were delayed. Current population figures are based on UN Population Division projections using 2011 census data as a baseline with demographic modeling for births, deaths, and migration patterns.
Priya was already typing. “So if all of them paid ₹4,000 per year…“
“Hold on,” I interrupted. “Not all 440 million can use a smartphone app. Let us be realistic.“
I pulled up mobile penetration data from a public platform. “Mobile phone usage in the 25-40 age group is about 85-90%, though smartphone penetration specifically is lower at around 60-70% for this demographic. So, we are looking at 440 million × 0.70 = 308 million potential smartphone users.”
“But Sir,” Priya said, “what about income levels? Not everyone can afford ₹4,000 per year for an app.“
“Excellent point. This is where most people mess up—they forget purchasing power.”
Based on income distribution analysis, approximately 15-20% of urban millennials earn above ₹4 lakhs annually – this demographic has higher earning potential than the national average, where only 10.75% of the workforce reaches this threshold.
We adjusted our numbers: 308 million × 0.18 = 55.4 million potential customers.
“So our TAM,” I calculated, “is approximately 55 million users × ₹4,000 = ₹2,20,000 crores.“
Priya’s eyes widened. “That is massive!“
“It is. But remember, this assumes we somehow capture every eligible millennial in India. Realistic? Not a chance. That is why we need SAM.”
Step 2: Calculating SAM (Serviceable Available Market)
“Now we get practical,” I said, pulling up more specific data. “SAM is about who we can actually reach and serve effectively.“
I started listing constraints on my notepad:
- Language barriers (English-speaking users)
- Geographic focus (urban areas only)
- Technology adoption (comfortable with fintech apps)
- Competition (market share we could realistically capture)
“Let us break this down,” I continued. “Our app will launch in English initially. What percentage of our TAM speaks English comfortably?“
Priya pulled up some data on her laptop. “According to 2011 census data and language surveys, around 10-12% of Indians speak English at any level, though the comfort level for digital services is even lower among our target demographic.”
Assuming that the data pertains to 2011, and assuming the population speaking English in India would have only increased, so let us use 12%.
“So we are looking at 55 million × 0.12 = 6.6 million potential users.”
“But we are also focusing on urban areas only,” I added. “These 6.6 million English speakers are spread across India. If we target metros and tier-1 cities where English penetration is significantly higher than national averages, we are looking at maybe 50-60% of this segment concentrated in major urban centers.”
New calculation: 6.6 million × 0.55 = 3.6 million potential users
“Wait,” Priya interrupted. “What about people who already use competing apps? Surely we cannot capture 100% market share.”
I nodded approvingly. “You are thinking like an analyst now. In mature fintech categories, getting 5-8% market share is considered excellent for a new player.“
“Let us be optimistic and assume we could eventually capture 8% of this serviceable market,” I said. “That gives us 3.6 million × 0.08 = 288,000 potential subscribers.“
“So our SAM is 288,000 × ₹4,000 = ₹115.2 crores,” Priya calculated quickly.
“Exactly. Much more realistic than ₹2,20,000 crores, would you not say?“
Step 3: Calculating SOM (Serviceable Obtainable Market)
“Now comes the reality check,” I said. “SOM is what we can actually achieve with our resources, timeline, and execution capabilities.“
I opened a new section in our spreadsheet. “Let us assume FinWell has ₹50 crores in funding and a three-year plan to reach profitability. What constraints does that create?“
Priya thought for a moment. “Marketing budget, team size, product development time…“
“Perfect. Let us work backwards from what is achievable.“
I started building a simple model:
- Year 1: Focus on Bangalore and Mumbai (2 cities)
- Year 2: Expand to Delhi, Chennai, Hyderabad (5 cities total)
- Year 3: Add Pune, Kolkata, Ahmedabad (8 cities total)
“With ₹15 crores annual marketing budget, decent conversion rates, and realistic growth assumptions, let us see what we get.“
I sketched out some numbers:
- Customer acquisition cost: ₹2,000 per user
- Annual churn rate: 25%
- Organic growth factor: 1.3x (referrals, word-of-mouth)
“Now, remember our SAM showed 288,000 potential subscribers total. But we cannot reach all of them simultaneously,” I explained.
“Given our city-by-city expansion strategy and marketing budget constraints, we might realistically penetrate about 60-70% of our SAM over three years. Let us use 65%.”
Calculation: 288,000 × 0.65 = 187,200 potential reach
“But not everyone we reach will convert. With our CAC and marketing effectiveness, we might achieve a 15% conversion rate from our target audience.”
Final SOM: 187,200 × 0.15 = 28,080 paying subscribers
“So our SOM is 28,080 × ₹4,000 = ₹11.2 crores in annual revenue,” Priya calculated.
“Exactly. That is what we can actually obtain with our current resources and strategy.”
The reality check moment
I leaned back and looked at our three numbers: –
- TAM: ₹2,20,000 crores
- SAM: ₹115.2 crores
- SOM: ₹11.2 crores
“See the pattern, Priya? Each calculation forced us to get more realistic about our assumptions.“
She nodded. “The TAM shows the opportunity is huge, but the SOM shows what is actually achievable.“
“Exactly. And this is where most startups go wrong. They pitch the TAM to get investors excited, but they do not have a credible path to even reach their SOM.“
“So if someone came to you with these numbers,” Priya asked, “would you invest?“
I smiled. “That depends on a lot more factors. But at least now we are having a conversation based on realistic assumptions rather than fantasy. And that is the whole point of this exercise.“
Practical tools and techniques
“Priya,” I said, minimizing our FinWell calculations, “now that you understand the logic, let me show you the tools that will make your life easier. Because doing this manually every time will drive you crazy.“
She laughed. “I was wondering how you do this so quickly for multiple clients.“
“Templates, my friend. Templates and knowing where to find reliable data.” I opened a fresh Excel workbook. “Let me build you a market sizing template that you can reuse for any business.“
“One important note, Priya,” I added. “The sources I am showing you today are mostly free and publicly available—perfect for learning and basic analysis.
But in your professional career, you will often need more detailed, current data that requires paid subscriptions to firms like McKinsey, BCG, Redseer, or specialized industry research companies. Budget for these subscriptions in your analysis projects—they are investments in accuracy.”
Building your Excel market sizing template
I started creating column headers while explaining each step.
“First, we need a section for assumptions,” I said, typing rapidly. “This is where most people mess up—they hardcode numbers directly into formulas and then forget what they assumed six months later.”
The template structure I built looked like this:
Section 1: Key assumptions
- Total population in the target demographic
- Smartphone/internet penetration rate
- Income qualification threshold
- Geographic focus (% of total market)
- Language/cultural barriers
- Competitive market share assumption
“See how each assumption gets its own cell with a clear label?” I pointed to the screen. “Now anyone can understand and modify your model.“
Section 2: TAM calculation
- Base population × penetration rates × income filters
- Revenue per customer × qualified customer base
- Built-in sensitivity toggles for different scenarios
“Priya, try changing the smartphone penetration from 85% to 70%,” I said. “Watch what happens to our TAM.“
She clicked the cell and modified it. Instantly, all our downstream calculations updated. “Wow, the TAM dropped by ₹1,05,000 crores!“
“Exactly. That is why sensitivity analysis is crucial. Small assumption changes create a massive impact.“
Section 3: SAM and SOM builders. I added sections for geographic constraints, competition analysis, and resource limitations.
“The beauty of this template,” I explained, “is that it forces you to document every assumption. When your boss asks why you assumed 8% market share, you are not scrambling to remember.”
Where to find reliable data
“Now for the golden question,” I said, opening multiple browser tabs. “Where do you get credible numbers without spending lakhs on consulting reports?“
I started bookmarking sites on Priya’s laptop:
Government sources (Free and Reliable)
- Census of India: Demographic breakdowns by age, income, location
- TRAI: Telecom and internet penetration data
- NSSO: Household spending patterns and income distribution
- Economic Survey: Annual economic indicators and trends
- RBI reports: Financial inclusion and digital payments data
“These are goldmines,” I told her. “Government data is often 1-2 years old, but it is accurate and free.“
Industry sources
- FICCI-PwC reports: Sector-specific market sizing
- NASSCOM: Technology adoption and digital trends
- BCG and McKinsey: Free reports on Indian market trends
- Google-Kantar studies: Consumer behavior insights
“The trick,” I explained, “is to cross-reference multiple sources. If TRAI says smartphone penetration is 85% and a Google report says 82%, you are probably in the right ballpark.”
International benchmarks
- World Bank: Comparative data across countries
- Statista: Industry statistics (some free, some paid)
- Company annual reports: Publicly listed competitors’ market data
“Do not ignore competitor filings,” I added. “If Paytm mentions their addressable market in India, that is incredibly valuable validation for your own calculations.“
Validating your assumptions
“Here is where most people stop, and that is a mistake,” I said, adding a new section to our template. “You need to stress-test every major assumption.”
I showed Priya how to build scenario analysis:
High, Medium, Low cases. For every key assumption, create three scenarios. What if smartphone adoption grows faster? What if your customer acquisition cost doubles? What if competition is fiercer?
I built toggles in the spreadsheet where she could switch between:
- Optimistic scenario (best-case assumptions)
- Base case (most likely assumptions)
- Conservative scenario (cautious assumptions)
“Watch this,” I said, switching to conservative mode. “Our SOM dropped from ₹11.2 crores to ₹7.3 crores.”
“That is a huge difference!” Priya exclaimed.
“Exactly. This is why you never present just one number. Always show the range. It demonstrates you have thought through the risks.“
Sanity check techniques I added a validation checklist to the template:
- Per capita check: Does your market size make sense when divided by population?
- Competitive comparison: How does your TAM compare to existing players?
- International benchmarks: Are similar markets in other countries sized similarly?
- Bottom-up validation: Do your numbers match when calculated differently?
“For FinWell, let us do a quick sanity check,” I said. “Our SOM assumes 28,080 subscribers paying ₹4,000 each. That is about 0.006% of Indian millennials. Does that sound reasonable for a fintech app?“
Priya thought for a moment. “Given that apps like Paytm have millions of users, 250,000 seems achievable for a niche product.“
“Perfect reasoning. You are getting the hang of this.“
Creating visual impact
“One last thing,” I said, opening PowerPoint. “Numbers in Excel are great for analysis, but terrible for presentations. Let me show you how to visualize market sizing.“
I created a simple funnel diagram:
- Top: Total Indian Millennials (440M)
- Middle: Urban, English-speaking, Income-qualified (3.6M)
- Bottom: Realistic market capture (28,080)
“This tells the whole story in one picture,” I explained. “Anyone can understand your market sizing logic instantly.“
I also built a pie chart showing SAM breakdown by city, and a bar chart comparing optimistic vs. conservative scenarios.
“Priya, visualization is not just about making pretty pictures. It is about making your assumptions transparent and your conclusions memorable.“
She was already sketching ideas in her notebook. “This makes so much more sense than just showing big numbers.“
“Exactly. Remember, your job is not just to calculate market size. It is to help decision-makers understand the opportunities and risks. These tools make that possible.“
I saved the template and sent it to her email. “There you go. Your market sizing toolkit. Use it, modify it, make it better. Just promise me you will never again present market sizing without showing your assumptions.“
She grinned. “Promise. But, sir, what about the red flags? How do I spot bad market sizing when I see it?“
Red flags & best practices
“Great question, Priya,” I said, leaning back in my chair. “In my fifteen years of reviewing business plans, I have seen the same mistakes over and over. Let me show you the biggest red flags.“
I pulled up a recent pitch deck that had crossed my desk. “This fintech startup claimed a TAM of ₹10,00,000 crores. Want to guess what they did wrong?“
She studied the slide. “That seems… really high?“
“Exactly. They took India’s entire GDP and called it their addressable market. Classic mistake number one.“
The big red flags
Flag #1: Fantasy TAM Numbers. When someone claims their TAM is larger than the entire established industries, run. I once saw a food delivery startup claim their TAM was ₹50,00,000 crores—bigger than India’s entire food and agriculture sector.“
Priya shook her head. “How do you even respond to that?“
“You do not. You just know they have not done their homework.“
Flag #2: Confusing TAM with SAM. “Here is another classic,” I said, flipping to another slide. “This company presented a ₹500 crore ‘TAM’ that was actually their realistic serviceable market. They had no idea how big the total opportunity was.”
“Why is that bad?” Priya asked.
“Because investors need to see both the big picture and your realistic slice. Mixing them up shows you do not understand your own market.“
Flag #3: Static Assumptions. I opened an old business plan from 2019. “Look at this. They assumed smartphone penetration would stay at 45% forever. Never updated their model as the market evolved.“
“That seems lazy,” Priya observed.
“It is. Markets change constantly. Your assumptions should too.“
Best practices that actually work
Keep it Transparent “Always show your work,” I emphasized. “Do not just say ‘our SAM is ₹200 crores.’ Explain exactly how you calculated it. What percentage of the population? Which cities? What income levels?“
I showed her a good example from a recent investment memo. Every assumption was clearly labeled with source citations.
The 3-Source Rule “Never rely on a single data point,” I advised. “If Census says one thing, TRAI says something similar, and a McKinsey report agrees, you are probably right. If you can only find one source, you need to dig deeper.“
Update Religiously “Set a calendar reminder to revisit your market sizing every six months,” I suggested. “New data comes out constantly. Your 2023 assumptions might be completely wrong by 2024.“
Priya was nodding along. “That makes sense. The market is not static.“
“Exactly. I have seen too many companies stick with outdated projections and miss major market shifts.“
Quick reality checks
“Before you finalize any market sizing,” I said, “ask yourself these questions:“
- Does this pass the common-sense test? If your TAM suggests every Indian will use your product, something is wrong.
- How does this compare to successful competitors? If Zomato’s market is X, can your food app really be 10X bigger?
- What would this mean per capita? If your calculation suggests every urban Indian spends ₹50,000 annually on your category, double-check your math.
“The best market sizing feels almost boring,” I concluded. “It should be logical, well-sourced, and conservative enough that nobody questions your sanity.“
Priya laughed. “So no claiming we will capture 50% market share in year one?“
“Please, no. I have seen that too many times.” I closed the laptop. “Ready to wrap this up with some final thoughts?“
Conclusion
“So Priya,” I said, looking at her filled notebook and the Excel templates on her screen, “what is your biggest takeaway from today?“
She thought for a moment. “That market sizing is not just about math—it is about telling a credible story with numbers.“
I smiled. “Perfect. You have got it.”
“TAM shows the big vision and proves the market opportunity is real. SAM demonstrates you understand your strategic focus and can identify your actual customers. SOM proves you are grounded in execution reality,” she continued, reading from her notes.
As she gathered her things, Priya paused. “Sir, one last thing. What if I get it wrong?“
“You will get it wrong sometimes,” I said honestly. “We all do. Markets change, assumptions break, new data emerges. The key is building models robust enough to handle uncertainty and transparent enough that others can spot the issues.“
She headed toward the door with a confident smile. “Thank you for teaching me this properly. I feel like I can actually contribute to strategy discussions now.“
Now, let me speak directly to you.
If you are reading this as a CA, CMA, MBA, or finance professional with a few years under your belt, you probably recognise yourself in Priya’s initial confusion. We have all been there—confidently throwing around TAM, SAM, SOM in meetings while secretly hoping nobody asks us to show the actual calculations.
Here is the reality: mastering market sizing is not optional anymore. Whether you are assisting domestic or international clients evaluating startups for your VC fund, building business cases for new product launches, or assessing acquisition targets in domestic and international markets, these frameworks are fundamental to every major decision you will make.
The difference between professionals who advance quickly and those who stay stuck often comes down to one thing: can you build financial models that people trust?
Can you size markets so convincingly that senior management bases ₹100 crore investments on your analysis?
Start applying these techniques today.
Take that startup pitch on your desk and rebuild their market sizing from scratch.
Question every assumption.
Cross-check their data sources.
Build your own TAM, SAM, and SOM models using the methods we have covered.
Because here is what I have learned after many years in finance: the person who can reliably separate real opportunities from fantasy projections becomes indispensable. That person gets invited to the strategy meetings that matter. That person becomes the voice senior leadership trusts.
Do not be the finance professional who nods along when someone presents a ₹10,00,000 crore TAM. Be the one who asks the tough questions, builds the credible models, and spots the genuine billion-rupee opportunities while others are still chasing unicorns.


 Allow notifications