Learn mergers and acquisitions (M&A) ratio analysis through a hypothetical example of TransGlobal’s acquisition of TechFlow Solutions. Discover how profitability, leverage, efficiency, and liquidity ratios drive decisions from initial screening to integration, plus the pro forma adjustments and synergy techniques that separate successful dealmakers from the rest.
Introduction
The conference room fell silent when I pulled up the final slide from my presentation. “And this is why I recommend we walk away from this deal.“
The private equity partners exchanged glances. This target company seemed perfect on paper, with its impressive revenue growth and industry positioning.
“What made you reach that conclusion?” asked the managing partner, leaning forward.
I pointed to my ratio analysis dashboard.
“The numbers tell a different story when you dig deeper. TechFlow’s current ratio has declined from 1.8x to 1.2x over three consecutive quarters, and working capital-to-sales dropped from 15% to 10%. When I normalized their 2024 EBITDA for one-time gains, their operating margin fell from 25% to 15% – a 10 percentage-point reduction. Plus, their pro forma debt service coverage ratio of 1.4x leaves no room for error if we add acquisition financing.“
Over several years of advising on M&A transactions, I have witnessed this scenario numerous times.
The smartest dealmakers I know do not fall in love with a company’s story; they let the numbers do the talking.
In the world of M&A, finance professionals do not just crunch numbers but perform ratio analysis as well. This helps them extract the deal’s DNA.
I am sure you will understand when I say that a single ratio, properly interpreted, can completely reshape negotiation leverage or kill a transaction outright.
Whether evaluating acquisition targets, preparing your company for sale, or analysing a competitor’s strategic moves, mastering the art and science of ratio analysis in the M&A context is the most important skill one must have or learn.
This article, the first in my three-part series, will equip you with the foundational knowledge to transform financial data into strategic insights that drive successful deals.
Throughout this article, I will share my experience working with TransGlobal Manufacturing (name changed due to confidentiality) as they navigated the acquisition of TechFlow Solutions, a $45M enterprise software company. This transaction illustrates the practical application of ratio analysis in M&A and provides real-world context for the concepts I am going to explore in this article.
Let me begin by unpacking what makes ratio analysis in M&A uniquely valuable – and challenging.
Understanding ratio analysis in M&A
“This company looks great at 5x EBITDA,” Robin, the CFO of TransGlobal Manufacturing, told me excitedly when they first discovered TechFlow Solutions in early 2024.
“But have you looked at their cash conversion cycle?” I asked.
Three weeks later, after proper ratio analysis, TransGlobal revised its offer to 4.5x EBITDA (aligning with risk-adjusted software industry multiples of 4x-6x for mid-market deals), and still needed careful structuring to avoid working capital issues.
Let me tell you one thing upfront: ratio analysis in M&A deals is not simply copying formulas from a financial accounting textbook. It is an art that requires a dynamic approach, the ability to look forward, and develop strategic insights.
If I were to explain the difference between standard ratio analysis and M&A ratio analysis to anyone?
I would say standard ratio analysis is a diagnostic checkup for a healthy patient. While M&A ratio analysis is like evaluating an athlete before offering him a multi-million-dollar contract.
In the case of M&A ratio analysis, you not only check if the athlete is healthy today, but also try to project his future performance under new conditions and assess his fitness with the existing team.
An efficiency metric for a deal, not just a company
Standard ratio analysis tells us how a business is performing in isolation.
M&A ratio analysis tells us how two businesses will perform together, after transaction costs, with new capital structures, and under integration stresses.
While working with TransGlobal on their acquisition of TechFlow Solutions, I always looked at three versions of every key ratio:
- TechFlow’s standalone metrics (historical and projected)
- TransGlobal’s existing metrics (historical and projected)
- The combined entity’s pro forma metrics (projected)
The differences between these three perspectives often revealed:
- Whether the deal would truly be accretive or dilutive to earnings
- How financing would impact the combined capital structure
- Where operational synergies might be realistic versus purely wishful thinking
The baseline vs. the battleground
In quarterly financial reporting, ratios serve as a baseline for tracking performance. In M&A, they become the battleground where deals are won or lost.
During the TechFlow transaction, the seller touted their impressive 24% gross margin based on their 2024 financials.
When TransGlobal’s team recalculated this ratio using normalised cost of goods sold, the actual margin remained 24%. However, after reclassifying certain engineering costs from capitalised R&D to operating expenses per GAAP standards, TechFlow’s operating margin dropped to 18.5%.
On TechFlow’s $76.4 million revenue, this 5.5 percentage-point operating margin reduction represented $4.2 million in annual EBITDA impact. At a 6x EBITDA multiple (typical for software companies with TechFlow’s risk profile), this justified a $25.2 million enterprise value adjustment, further supported by cash flow and synergy analyses.
That was not just about mathematical precision. It was an attempt to explain that every decimal point in ratio analysis has enormous financial implications when magnified across a transaction value.
Ratios in M&A describe reality, establish the valuation framework, inform financing terms, and drive negotiation strategy.
The art of context
“Why does TechFlow’s DSO spike to 65 days in Q3 each year?” I asked Robin’s team during due diligence, noting that this was well above the software industry average of 30-40 days.
Days Sales Outstanding (DSO) is a working captial raio that tells you how long, on average, it takes a company to collect payment after making a sale on credit.
TechFlow DSO Trends (Quarterly Analysis)
| Quarter | DSO (Days) | Industry Benchmark |
| Q1 2024 | 38 | 30-40 |
| Q2 2024 | 42 | 30-40 |
| Q3 2024 | 65 | 30-40 |
| Q4 2024 | 41 | 30-40 |
After investigation, we learned it was not poor collection practices but a sales compensation plan that drove significant end-of-quarter contract signings in Q3. This insight did not kill the deal but informed how TransGlobal would restructure sales incentives post-closing.
Context transforms ratio analysis from a mechanical exercise into a strategic advantage. A 2.3x current ratio might be healthy for a manufacturing company like TransGlobal, but concerning for a software company. TechFlow’s 65-day peak DSO was problematic compared to software industry standards, but normal for manufacturing.
In M&A, ratios must be evaluated against:
- Industry benchmarks and competitors
- Historical company trends
- Future projections considering the deal structure
- Post-integration business model changes
- Geographic and regulatory variations
This contextual approach separates truly valuable ratio analysis from simple spreadsheet calculations. The ability to spot anomalies, understand their underlying causes, and project their impact on the combined entity separates elite deal advisors from average analysts.
When you are conducting ratio analysis for M&A, you are not just measuring what is – you are creating a financial model of what will be. And that requires a fundamentally different mindset.
When ratio analysis is used in deal-making
Most corporate finance textbooks present ratio analysis as a periodic reporting exercise – calculate, review, file away. But in M&A, ratio analysis is a dynamic, evolving process that drives decision-making at every stage of the transaction.
During a tense strategy session with TransGlobal’s investment committee, I watched their financial analyst present TechFlow’s debt-to-EBITDA ratio.
“That’s helpful,” Robin nodded, “but what’s TechFlow’s forecasted leverage after we layer in acquisition debt? And how quickly can we de-lever based on projected cash flows?“
The analyst hesitated, unprepared for this forward-looking question.
“In M&A,” I explained later to the team, “the same ratio tells different stories depending on when you calculate it and what question you are trying to answer. Using the right ratio at the right moment can make the difference between a value-creating deal and a financial disaster.“
The deal lifecycle approach
Let me walk you through how TransGlobal systematically deployed ratio analysis across their acquisition of TechFlow Solutions, and how the focus evolved at each stage:
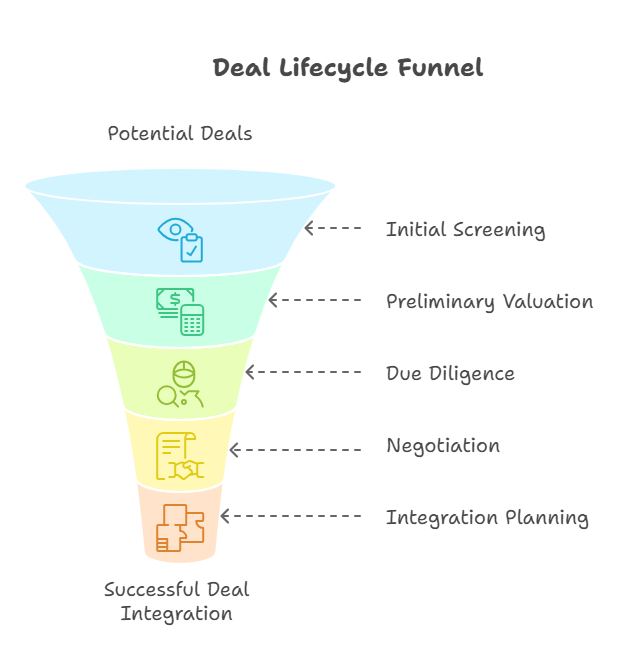
1. Initial Screening (Target Identification)
Before committing significant resources to TechFlow, TransGlobal used high-level ratio analysis to filter potential targets from a broad universe of companies.
“I always tell my team to simultaneously screen 20-30 companies,” Robin explained during our planning session. “At this stage, we’re asking: Can this company help us hit our 15% annual growth target without diluting our current 22% operating margin?“
The analysis at this phase focused on easily obtainable metrics from public information and industry databases:
- Revenue growth trajectory (3-year CAGR)
- EBITDA margin stability
- Return on invested capital compared to industry averages
- Cash conversion cycle efficiency
TransGlobal’s disciplined approach allowed them to quickly narrow their focus from dozens of potential targets to TechFlow and two other promising candidates without expensive advisory fees or management distraction.
2. Preliminary Valuation (Opportunity Assessment)
With TechFlow identified as a priority target, the ratio analysis deepened as TransGlobal began building preliminary valuation models and considering potential deal structures.
During this phase, what appeared to be a straightforward valuation dramatically shifted after calculating TechFlow’s customer concentration ratio.
“Despite impressive profitability metrics, we discovered 68% of TechFlow’s revenue came from just two customers,” I told the valuation team. “This hidden concentration risk justified reducing our initial multiple from 6x to 4.5x EBITDA – a 25% valuation adjustment.“
The ratio focus expanded to include:
- Customer and supplier concentration metrics
- Working capital intensity compared to TransGlobal’s existing business
- Quality of earnings analysis (CFO-to-EBITDA ratios showing 80% cash conversion)
- Segment-level profitability ratios to identify true value drivers
This deeper analysis prevented TransGlobal from overvaluing TechFlow based on superficial metrics and positioned them for more effective negotiation.
3. Due Diligence (Verification and Discovery)
The due diligence phase represented the most intensive period of ratio analysis, where TransGlobal’s team gained direct access to TechFlow’s detailed financial information over 10 weeks.
“In due diligence, we’re stress-testing everything,” I emphasized to Robin’s team. “I’ve seen countless deals where working capital ratio analysis revealed that a target was manipulating quarter-end cash positions by delaying vendor payments. Without drilling into daily liquidity ratios, you would inherit a cash flow nightmare.“
The ratio analysis during this phase became both deeper and broader:
- Detailed trend analysis of all key ratios over multiple years
- Comparison of stated vs. normalised ratios after accounting adjustments
- Breakdown of ratios by business unit, product line, and geography
- Variance analysis to identify seasonality and anomalies
- Development of pro forma ratios for the combined entity
TransGlobal discovered during this phase that TechFlow’s inventory turnover ratio (relevant for their hardware resale products) deteriorated significantly when calculated on a monthly rather than quarterly basis, revealing end-of-quarter window dressing that would have created post-merger integration challenges.
4. Negotiation (Value Capture)
Throughout the 5-week negotiation process, TransGlobal leveraged ratio analysis to support their position on valuation, deal structure, and terms.
As negotiations progressed with TechFlow, we effectively used customer acquisition cost analysis to secure better terms. By demonstrating that TechFlow’s CAC-to-LTV ratio had worsened – CAC increased 32% from $10,000 to $13,200 per customer while customer lifetime value remained flat at $45,000 – we established that the business model had reached an inflection point requiring additional investment.
“When we showed them their own ratio trends,” Robin recalled, “they could not argue with the data. It justified our position for the 4.5x multiple and better earn-out structure.“
Ratio analysis during negotiations focused on:
- Identifying specific value drivers to protect in the purchase agreement
- Quantifying risks that justified price adjustments or escrow provisions
- Supporting earnout structures with clear, ratio-based performance metrics
- Determining optimal financing structure based on pro forma coverage ratios
This analytical approach transformed negotiation from subjective arguments about value to data-driven discussions about business fundamentals.
5. Integration Planning (Value Realisation)
Long before the deal closed, TransGlobal established ratio-based performance benchmarks for the integrated entity that would guide post-merger integration over the first 18 months.
Working with Robin’s technology team, I emphasized the importance of tracking weekly progress against pre-deal efficiency ratio projections.
“We promised shareholders $15 million in synergies based on improving the combined customer acquisition efficiency and cross-selling ratios,” I reminded them. “Every decimal point represents real money, so monitor it constantly.“
The integration phase shifted ratio analysis from diagnostic to prescriptive:
- Synergy tracking dashboards with ratio-based KPIs
- Weekly operational ratio monitoring during the critical first 100 days
- Cash flow and working capital ratios to manage transition disruption
- Employee productivity ratios to evaluate organisational effectiveness
This disciplined approach to ratio-based integration management helped TransGlobal achieve $16.3 million in synergies (109% of their $15 million target), compared to just 35% realisation in their previous acquisition, where they lacked this structured framework.
| Stage | Duration | Key Ratios | Primary Purpose |
| Initial Screening | 2 weeks | Revenue CAGR, EBITDA margin, ROIC vs WACC | Filter targets efficiently |
| Preliminary Valuation | 3-4 weeks | Customer concentration, working capital intensity, and cash conversion | Build valuation models |
| Due Diligence | 8-12 weeks | Detailed trend analysis, normalised ratios, pro forma metrics | Verify and discover risks |
| Negotiation | 4-6 weeks | Value driver ratios, risk quantification metrics | Support deal terms |
| Integration Planning | 6 months+ | Synergy tracking KPIs, operational efficiency ratios | Realise projected value |
From diagnostic to predictive
The most powerful aspect of M&A ratio analysis is its evolution from diagnostic to predictive as a deal progresses.
Early in TransGlobal’s acquisition process, we used gross margin analysis by product line to assess TechFlow’s historical performance. During due diligence, these same ratios helped us model product rationalisation opportunities.
By closing, they had become the weekly performance benchmarks for the integration team’s first 100 days.
“The best M&A analysts connect ratio movements to operational realities,” I told Robin’s junior associates during our training session. “When you see a declining asset turnover ratio, don’t just see a number – see underutilised technology infrastructure, which tells you where cost synergies might exist.“
This ability to translate ratios into business insights, and then into deal strategy, separates successful acquirers from those who overpay for underperforming assets.
It is a skill developed through deliberate practice across multiple transactions, and one that has transformed how TransGlobal approaches every stage of its deal-making process.
Key ratio categories: profitability, leverage, efficiency, liquidity
One time, I sat across from Robin, who proudly announced they had found the perfect acquisition target with a 25% EBITDA margin.
“That’s promising,” I nodded, “but what about their debt service coverage ratio and cash conversion cycle?“
The ensuing silence told me everything. They had fallen into the common trap of fixating on a single ratio category while ignoring the complete financial picture.
Let me share the M&A ratio analysis framework we developed for TransGlobal’s acquisition of TechFlow Solutions, organised into four critical categories that tell different parts of the same story.
Financial ratio glossary
Before diving deep, let me define the key ratios I will be discussing below:
Profitability Ratios:
- Gross Margin: (Revenue – COGS) / Revenue × 100
- EBITDA Margin: EBITDA / Revenue × 100
- Operating Margin: Operating Income / Revenue × 100
- ROIC: NOPAT / Invested Capital × 100
Leverage Ratios:
- Debt-to-EBITDA: Total Debt / EBITDA
- Interest Coverage Ratio: EBITDA / Interest Expense
- Debt Service Coverage Ratio: Operating Cash Flow / Total Debt Service
Efficiency Ratios:
- Asset Turnover: Revenue / Total Assets
- DSO: (Accounts Receivable / Annual Sales) × 365
- Revenue Per Employee: Total Revenue / Number of Employees
Liquidity Ratios:
- Current Ratio: Current Assets / Current Liabilities
- Quick Ratio: (Current Assets – Inventory) / Current Liabilities
- Operating Cash Flow Ratio: Operating Cash Flow / Current Liabilities
Profitability ratios: the strategic why
Profitability ratios answer the fundamental question: Why are we doing this deal?
In TransGlobal’s analysis of TechFlow, I looked beyond the standard metrics to uncover profitability patterns that would impact valuation and integration:
- Gross margin trend: I always calculate this quarterly, not just annually. TechFlow’s consistent quarterly gross margin of 24% signaled stable pricing power that would continue post-acquisition.
- Operating margin by business unit: When integrating operations, knowing which units drove profitability helped TransGlobal prioritise what to keep, expand, or sunset.
- EBITDA margin with adjustments: Standard EBITDA often hides owner perks, one-time events, and accounting choices. We normalised TechFlow’s EBITDA to reveal their “real” margin.
- Return on Invested Capital (ROIC) vs. WACC: This spread predicted whether TransGlobal’s deal would create or destroy value. We nearly restructured the transaction when this calculation initially showed marginal value creation.
When reviewing TechFlow’s business units during the acquisition, the company’s overall EBITDA margin looked attractive at 22%.
However, breaking it down by business unit revealed that their legacy enterprise software operated at 32% EBITDA margin while their “growth” cloud products ran at just 7%. This insight completely restructured TransGlobal’s integration and investment plans, leading them to prioritise the legacy business while scaling back cloud expansion.
Leverage ratios: the financial risk profile
Leverage ratios determined TransGlobal’s deal structure and financing options. I always calculated these for both TechFlow standalone and the pro forma combined entity:
TechFlow Debt-to-EBITDA Analysis
| Stage | Debt ($M) | EBITDA ($M) | Debt-to-EBITDA | Notes |
| Reported (2024) | 21.0 | 10.0 | 2.1x | Based on TechFlow’s audited financials |
| Normalised | 21.0 | 10.5 | 2.0x | Added back $0.5M normalized owner compensation |
| Pro Forma | 36.0 | 9.7 | 3.7x | Added $15M acquisition debt, $0.8M transaction costs |
| Post-Synergies (Year 2) | 34.0 | 11.2 | 3.0x | $1.5M annual synergies, $2M debt paydown |
- Interest coverage ratio: Shows breathing room for debt service. I insisted on maintaining a minimum 2.5x coverage for TransGlobal’s deal to be sustainable.
- Debt service coverage ratio: The most important metric lenders examine. It revealed whether operating cash flow could handle principal and interest payments.
- Fixed charge coverage ratio: Particularly relevant when leases or preferred dividends exist in the capital structure.
“Most acquisition models break because they underestimate how leverage impacts operational flexibility,” I told Robin. “When your leverage ratio climbs above 4.0x in the software industry, every operational hiccup becomes an existential crisis.“
Efficiency ratios: the integration opportunity
Efficiency ratios revealed where synergies actually existed versus where they were merely hoped for in TransGlobal’s acquisition of TechFlow:
- Asset turnover: Measures how effectively assets generate revenue. Disparities between TransGlobal (2.1x) and TechFlow (1.6x) highlighted technology infrastructure utilisation opportunities.
- Days sales outstanding (DSO): Revealed collection efficiency differences that represented quick integration wins. TechFlow’s average 45-day DSO vs. TransGlobal’s 35-day DSO showed improvement potential.
- Revenue per employee: Helped quantify headcount rationalisation opportunities without resorting to arbitrary cuts.
TechFlow showed revenue per employee of $185,000 while TransGlobal operated at $220,000. This $35,000 per employee difference represented a significant productivity improvement opportunity through applying TransGlobal’s operational systems and processes, effectively contributing $2.1 million annually to the synergy business case (60 TechFlow employees × $35,000).
Liquidity ratios: the deal sustainability test
Liquidity ratios ensured TransGlobal’s combined entity could survive post-close disruption:
- Current ratio: TechFlow’s declining current ratio from 1.8x to 1.2x over three quarters signaled liquidity constraints that required immediate attention.
- Operating cash flow ratio: The ability to cover short-term obligations from operations, not just balance sheet resources. TechFlow’s 0.85x ratio was concerning.
- Cash conversion cycle: Revealed how efficiently TechFlow turned operations into cash, critical for determining working capital needs.
- Working capital to sales: TechFlow’s declining ratio from 15% to 10% helped predict future cash needs as the business would grow post-acquisition.
“In M&A liquidity analysis, I always stress-test these ratios by modeling 15% revenue decline and 60-day customer payment delays simultaneously,” I told Robin’s team. “If the model breaks under those conditions, the deal structure needs rethinking.“
How do different stakeholders interpret these ratios
As we worked with TransGlobal on the TechFlow acquisition, we encountered different stakeholders who emphasized different ratios:
Investment bankers typically focus on EBITDA margins and growth rates to drive valuation multiples. When presenting TechFlow to potential lenders, we highlighted three-year margin stability prominently.
Private equity investors scrutinised leverage capacity and cash conversion metrics to determine how much debt the deal could support. They were seeking at least 20% IRR, which meant TechFlow’s leverage and cash flow ratios had to support rapid debt paydown.
TransGlobal’s board, as strategic buyers, prioritised efficiency ratios that identified synergy opportunities and profitability metrics that predicted accretion/dilution. They needed to justify the TechFlow deal to shareholders using EPS impact analysis, not just strategic fit.
Understanding these different perspectives helped us position the TechFlow acquisition appropriately for each audience, maximising support for TransGlobal regardless of which stakeholder we were presenting to.
While ratio analysis provides the quantitative foundation for M&A decisions, qualitative factors like TechFlow’s management retention potential and cultural alignment with TransGlobal were equally important for ensuring long-term deal success.
Adjustments unique to M&A (Pro Forma, Synergies, Normalisations)
“These 2024 financial statements are clean. I do not see why we need to make so many adjustments.”
Robin said during our review meeting, glancing at the stack of TechFlow’s due diligence reports. I smiled, remembering how I had once held the same misconception early in my career.
“Clean statements and M&A-ready statements are two entirely different things,” I explained.
“Remember when we thought TechFlow was overvalued at 6x EBITDA until we normalised their R&D spending and discovered their actual risk profile? Proper adjustments make the difference between paying premium prices for average companies and fair prices for excellent ones.“
In standard financial analysis, you take the numbers largely as presented.
In M&A ratio analysis, virtually every number requires scrutiny and potential adjustment.
Let me walk you through the critical adjustment categories that transformed standard ratios into powerful M&A decision tools for TransGlobal’s acquisition of TechFlow.
Normalising historical performance
“Why are we adding back the founder’s $850,000 total compensation when calculating TechFlow’s normalised EBITDA?” asked one of Robin’s analysts during our session on seller’s discretionary earnings.
“Because post-acquisition, we will replace him with a $220,000 VP of Operations,” I explained.
“The extra $630,000 represents above-market owner compensation, not true operating expense. This normalisation shows TechFlow’s sustainable profitability under market-rate management.“
Normalisation adjustments remove distortions to show how TechFlow would perform under normal operating conditions with market-rate expenses.
At TransGlobal, we regularly applied these adjustments to TechFlow’s financials:
- Owner compensation normalisation: Replacing TechFlow’s above-market founder salary and perks with market-rate executive compensation
- Non-recurring events: Eliminating one-time expenses or revenues (TechFlow had a $1.2 million litigation settlement in 2023)
- Accounting method standardisation: Adjusting for different accounting treatments (TechFlow capitalised certain development costs that TransGlobal expensed per their accounting policy)
- Related party transactions: Adjusting non-arm’s-length transactions to market rates (TechFlow paid below-market rent to a founder-controlled real estate entity)
During TransGlobal’s assessment of TechFlow, we discovered their maintenance expenses fluctuated wildly from 1.2% to 3.5% of revenue over three years. Investigation revealed they had deferred software infrastructure maintenance during a 2022 cash crunch, creating a maintenance backlog.
We normalized maintenance expenses to a consistent 2.8% of $50 million revenue ($1.4 million annually) based on software industry benchmarks, reducing TechFlow’s historical EBITDA by $1.4 million annually but creating a more realistic valuation baseline.
Pro Forma adjustments: creating the combined picture
“How will our interest coverage ratio change after the TechFlow acquisition?” Robin asked during financing discussions. This required pro forma analysis projecting the combined entity’s performance as if the transaction had already occurred.
Pro forma adjustments modeled the financial impact of:
- Capital structure changes: The impact of acquisition debt on interest expense and leverage ratios
- Transaction costs: One-time expenses like banker fees ($800,000), legal costs ($400,000), and severance ($300,000)
- Accounting policy harmonization: Aligning TechFlow’s accounting with TransGlobal’s practices
- Discontinued operations: Removing TechFlow’s legacy hardware business that wouldn’t transfer in the deal
When modeling TransGlobal’s acquisition of TechFlow, we created three pro forma scenarios:
Pro Forma Scenario Analysis
| Scenario | EBITDA ($M) | Total Debt ($M) | Annual Synergies ($M) | Debt-to-EBITDA |
| Base Case | 10.5 | 36.0 | 1.5 | 3.4x |
| Optimistic | 11.0 | 34.0 | 2.0 | 3.1x |
| Conservative | 9.7 | 38.0 | 1.0 | 3.9x |
The conservative case showed our debt-to-EBITDA ratio would temporarily exceed our bank covenant threshold of 3.5x, which prompted us to negotiate a temporary covenant step-down before closing.
“Pro forma models aren’t about predicting the exact future,” I reminded Robin. “They’re about identifying the range of potential outcomes to manage risks and set realistic expectations with stakeholders.“
Synergy adjustments: quantifying the combination premium
The true value in M&A often lies in synergies – the benefits achieved only through combining the companies. Yet, synergy projections are where I see the most wishful thinking in deal modeling.
“Everyone claims 30% cost synergies, but how many actually achieve them?” I asked Robin’s integration team as we developed realistic synergy estimates for the TechFlow deal.
At TransGlobal, we categorised synergy adjustments for TechFlow into:
- Cost synergies: Measurable expense reductions from consolidating operations, systems, and personnel
- Revenue synergies: Additional revenue from cross-selling TechFlow’s software to TransGlobal’s manufacturing clients
- Financial synergies: Benefits from improved capital structure, tax efficiency, or working capital optimisation
- Strategic synergies: Harder-to-quantify benefits like technology access or competitive positioning
We developed a disciplined approach to synergy adjustments for TechFlow. For each claimed synergy, we required:
- Specific calculation methodology
- Timeline for realisation
- Implementation costs
- Responsible executive
- Risk factors that could prevent achievement
TechFlow Synergy Analysis
| Synergy Type | Annual Value ($M) | Implementation Cost ($M) | Timeline | Confidence Level |
| Headcount optimisation | 8.5 | 2.1 | 12 months | 85% |
| Technology consolidation | 3.2 | 1.8 | 18 months | 70% |
| Cross-selling revenue | 2.8 | 0.5 | 24 months | 60% |
| Working capital optimisation | 1.5 | 0.3 | 6 months | 90% |
| Total Projected | 16.0 | 4.7 | 24 months | Weighted 75% |
This framework transformed how TransGlobal approached synergy valuation.
In their previous acquisition, they had claimed $22 million in annual synergies but realised only $8 million (36%). Using our structured approach for TechFlow, they projected $16 million and achieved $16.3 million within 18 months of closing – 102% realisation.
The interplay between adjustments and ratio analysis
These adjustments do not exist in isolation – they dramatically impact every ratio you calculate.
Let me show you how adjustments transformed TransGlobal’s key ratio analysis for TechFlow:
This progression shows how each adjustment layer provided a more accurate picture of the deal’s true financial impact. Without this stepped approach, TransGlobal might have misunderstood its post-deal leverage position by over 45%.
Building your adjustment toolkit
“How do you know which adjustments to make?” Robin asked me during a late-night preparation session before their board presentation on the TechFlow acquisition.
The answer comes from experience, but there are guidelines I’ve developed over years of transaction advisory:
- Materiality threshold: Only make adjustments that impact EBITDA by at least 3% or significantly alter key ratios
- Evidence standard: Every adjustment must have clear documentation and logical justification following GAAP/IFRS standards
- Consistency principle: Apply adjustment methodologies consistently across all companies being compared
- Conservative bias: When uncertain, make adjustments that reduce rather than enhance apparent value
- Multiple scenario modeling: Create base, optimistic, and conservative adjustment cases
“The goal isn’t perfect prediction,” I told Robin. “It is about removing noise from the data so you can make clear-eyed decisions based on business fundamentals rather than accounting artifacts or temporary conditions.“
TransGlobal now uses a standardised M&A ratio adjustment checklist that helps them normalise financial statements before calculating any ratios. This consistent methodology has dramatically improved their acquisition success rate, from 2 problematic deals out of 5 before implementing this approach to 7 successful integrations in their last 8 transactions.
By mastering these adjustment techniques, you transform standard ratio analysis into a powerful M&A decision-making framework, capable of revealing insights that superficial analysis would miss entirely.
Put your knowledge into practice: mini-exercises
As we wrap up our exploration of M&A ratio analysis, I would like to share a practical exercise that Robin’s team at TransGlobal now uses to train new financial analysts. These thought exercises will help solidify your understanding and prepare you for applying these concepts in real-world scenarios.
Exercise 1: The target screening challenge
Industry Context: All companies operate in the enterprise software sector, where typical benchmarks are:
- DSO: 30-40 days
- Debt-to-EBITDA: 2-3x for healthy companies
- EBITDA margins: 15-25% for mature software companies
- Revenue per employee: $180K-$250K
Scenario: You are the M&A analyst for a strategic buyer seeking to acquire a software company that can integrate smoothly while maintaining growth. Your company’s internal hurdle rate is 15% IRR, and you prefer deals that can achieve investment-grade credit metrics post-acquisition.
Here are three potential targets:
Company A (CloudFlow Systems)
- Revenue: $75M (15% annual growth, 3-year CAGR)
- EBITDA: $16.5M (22% margin)
- Total Debt: $34.7M (Debt/EBITDA: 2.1x)
- Cash Conversion Cycle: 65 days
- Revenue per Employee: $195K (385 employees)
- Customer Concentration: Top 5 customers = 45% of revenue
- Geographic Mix: 80% North America, 20% International
Company B (TechStream Solutions)
- Revenue: $45M (22% annual growth, 3-year CAGR)
- EBITDA: $8.1M (18% margin)
- Total Debt: $10.5M (Debt/EBITDA: 1.3x)
- Cash Conversion Cycle: 42 days
- Revenue per Employee: $225K (200 employees)
- Customer Concentration: Top 5 customers = 25% of revenue
- Geographic Mix: 70% North America, 30% International
Company C (EnterpriseMax Corp)
- Revenue: $95M (8% annual growth, 3-year CAGR)
- EBITDA: $23.8M (25% margin)
- Total Debt: $80.9M (Debt/EBITDA: 3.4x)
- Cash Conversion Cycle: 85 days
- Revenue per Employee: $238K (400 employees)
- Customer Concentration: Top 5 customers = 60% of revenue
- Geographic Mix: 60% North America, 40% International
Questions for Analysis:
- Initial Screening: Based on the quantitative metrics alone, rank these companies from most to least attractive. Explain your reasoning using specific ratio comparisons.
- Risk Assessment: Which company presents the highest integration risk, and why? Consider both financial and operational factors.
- Additional Due Diligence: What three specific ratios would you want to calculate next before making a final recommendation? Explain why each ratio would be critical for your decision.
- Strategic Fit Evaluation: If your acquiring company operates at $220K revenue per employee and 20% EBITDA margins, which target offers the best synergy potential?
Guided Thinking: Consider that Company B’s high growth but lower margins might indicate early-stage scaling, while Company C’s high margins but elevated leverage could signal maturity with financial constraints.


 Allow notifications